Product release
Boost your businesses with Mappls’ industry-leading optimisation APIs and SDKs to bring the best and most efficient ways to deliver goods, save time and increase profits.
or
Boost your businesses with Mappls’ industry-leading optimisation APIs and SDKs to bring the best and most efficient ways to deliver goods, save time and increase profits.


(With Mappls Interactive Map JS Library)
https://apis.mapmyindia.com/advancedmaps/v1/your_map_key_here/map_load?v=1.3&plugin=geoanalytics
where: plugins available are:
This method gets the layer specified which is stored in Mappls' Database and gives a WMS layer as an output with any filters or styles specified by the user. Example: geoAnalytics.getState, geoAnalytics.getCity, geoAnalytics.getPincode, etc.
geoAnalytics.get<LayerName>
where
Parameters
Parameters are sent to the APIs as geoparams
Example
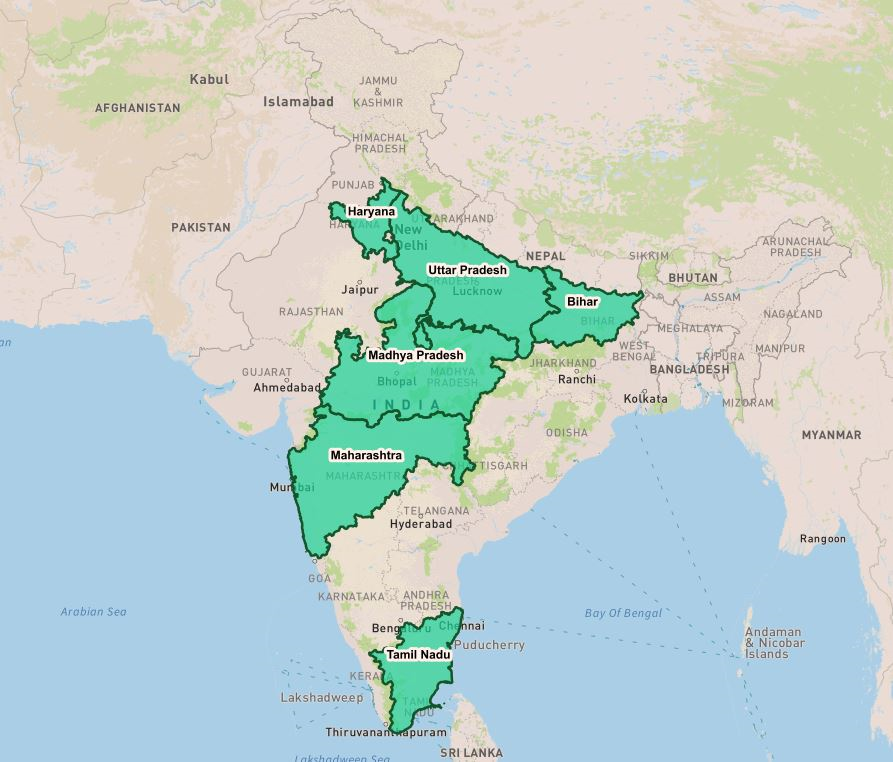
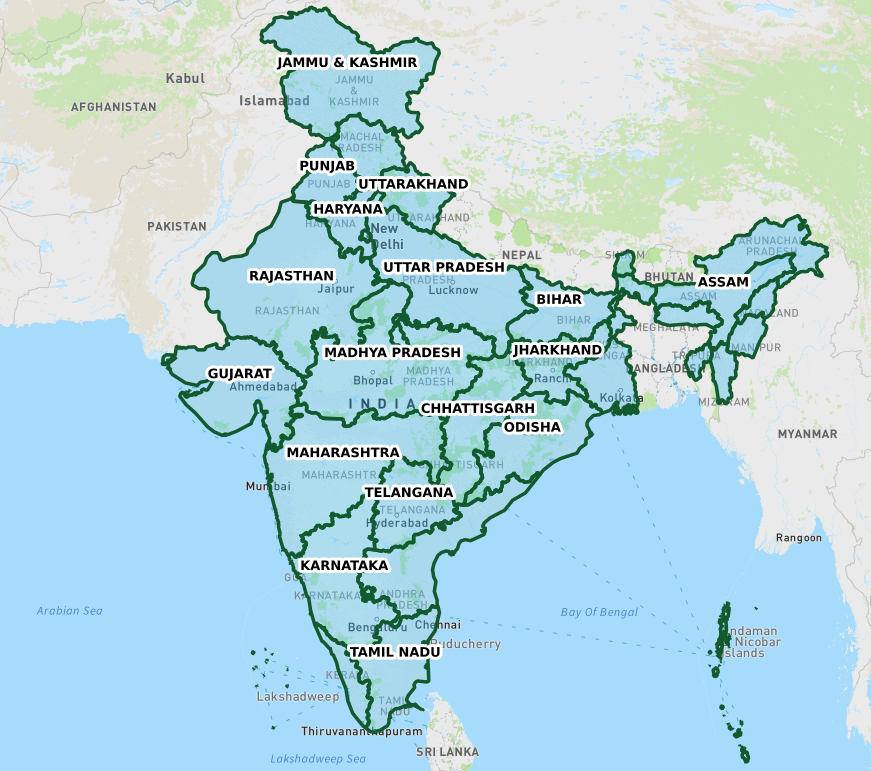
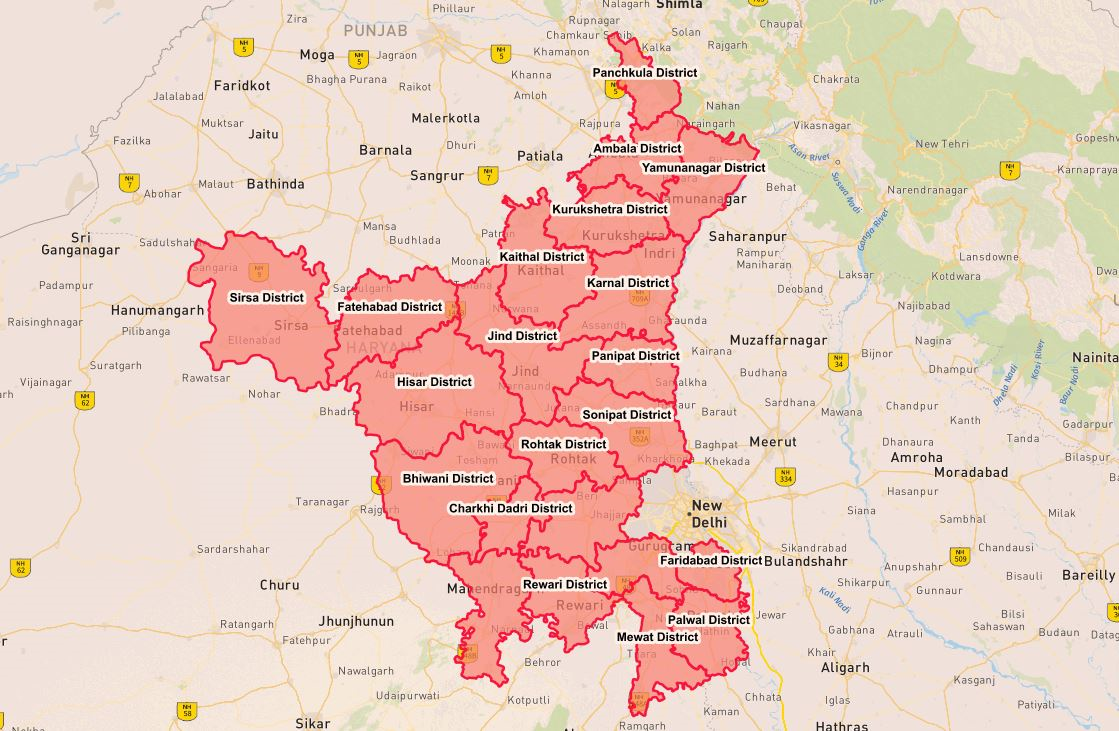
var geoParams =
{
	GeoBoundType	:	'stt_nme',
	GeoBound		:	['haryana'],
	Attribute		:	't_p',
	Query			:	'>10000',
    Style:
		{
			Label		:	true,
			LabelColor	:	'13592e',
			LabelSize	:	10,
			FillColor	:	'ffe0aa',
			BorderColor	:	'13592e',
			BorderWidth	:	2,
			Opacity		:	0.5
       }
};
var GeoDataLayer = geoAnalytics.getPanchayat(geoParams);
map.addLayer(GeoDataLayer);
To get the list of available layer's and attribute's names, please use the Listing API available here.
Now that you’re all caught up with the features, let's get down right to them and look at how you can integrate our Interactive Map JS API in conjunction with the above geoAnalytics methods to add data on that map to your Website from scratch.
Follow the documentation of Interactive Map API to integrate Mappls Interactive Maps into your existing code base.
To add a DataLayer to the map, go through the following steps after declaring the map object:
var geoParams =
{
	GeoBoundType	: 	'stt_nme',
	GeoBound	: 	['haryana'],
	Attribute		:	't_p',
	Query		:	'>10000',
	Style		:
		{
	        Label	:	 true,
	        LabelColor	: 	'13592e',
	        LabelSize	: 	10,
	        FillColor	: 	'ffe0aa',
			BorderColor	 :	 '13592e',
			BorderWidth  :	 2,
			Opacity	: 	0.5
		}
};
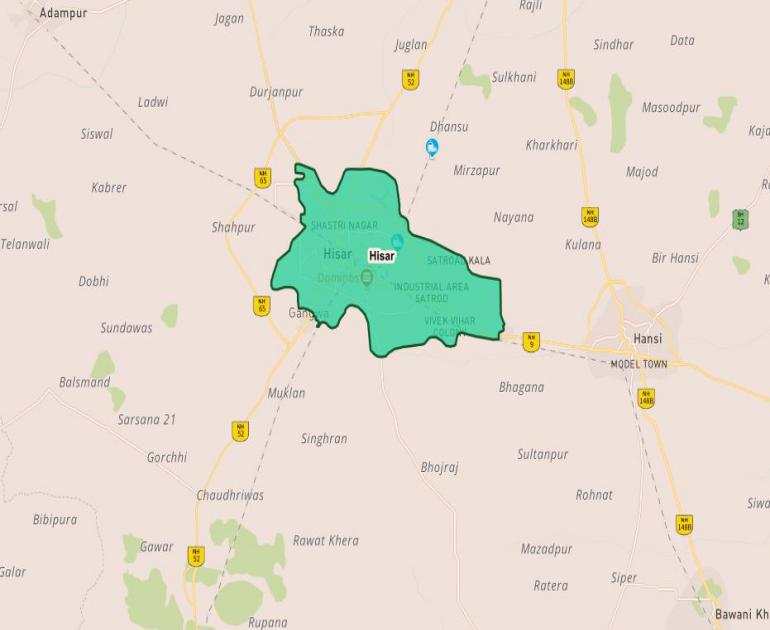
Info Windows are a convenient way of showing data about a point in the DataLayer. The expected behaviour of a user to know about any point in the DataLayer is to try and click on it to know what it is all about. The mechanism to accomplish this is by showing an info window. The info window for a DataLayer(created previously) can be obtained through following steps:
 map.on('click', function(e)
{
// e stands for the event in which the click happens
});
 map.on('click', function(e)
{
var propertyName = 'stt_nme,stt_id,t_p,t_m,t_f,label';
});
 map.on('click', function(e)
{
var propertyName = 'stt_nme,stt_id,t_p,t_m,t_f,label';
var Infodata = geoAnalytics.getFeatureInfo(e,propertyName,GeoDataLayer);
});
 map.on('click', function(e)
{
var propertyName = 'stt_nme,stt_id,t_p,t_m,t_f,label';
var Infodata = geoAnalytics.getFeatureInfo(e,propertyName,GeoDataLayer);
var html = "";
if(Infodata.features[0])
			{
	 html += "<div class='mainlabel_details'><label class='label_name'>Town Name:</label> " + Infodata.features[0].properties["twn_nme"] + ""</div> ";
	 html += "<div class='mainlabel_details'><label class='label_name'>State ID:</label> " + Infodata.features[0].properties["stt_id"] + ""</div>";

	 html += "<div class='mainlabel_details'><label class='label_name'>State Name:</label> " + Infodata.features[0].properties["stt_nme"] + ""</div> ";

	 html += "<div class='mainlabel_details'><label class='label_name'>Total Population:</label> " + Infodata.features[0].properties["t_p"] + ""</div> ";

	 		}
	 			  else if(Infodata.features[0] == undefined)
	 			  	  console.log("Not Exists");
});
map.on('click', function(e)
{
var propertyName = 'stt_nme,stt_id,t_p,t_m,t_f,label';
var Infodata = geoAnalytics.getFeatureInfo(e,propertyName,GeoDataLayer);
var html = "";
if(Infodata.features[0])
	{
	html += "<div class='mainlabel_details'><label class='label_name'>Town Name:</label> " + Infodata.features[0].properties["twn_nme"] +"</div>";
	html += "<div class='mainlabel_details'><label class='label_name'>State ID:</label>" + Infodata.features[0].properties["stt_id"] + "</div>";
	html += "<div class='mainlabel_details'><label class='label_name'>State Name:</label> " + Infodata.features[0].properties["stt_nme"] + "</div> ";
    html += "<div class='mainlabel_details'><label class='label_name'>Total Population:</label> " + Infodata.features[0].properties["t_p"] + "</div> ";

    L.popup({ maxWidth: 800})
      .setLatLng(e.latlng)
      .setContent(html)
     .addTo(map);
          	  }
	  else if(Infodata.features[0] == undefined)
	  console.log("Not Exists");
	}
);